
Post-processing in Python#
Note
Read first: Simple simulation.
The results in simulation.sim are text files (see Simulation Results (simulation.cfg)), which
NumPy reads directly. This tutorial reads the results of Simple simulation with a short
Python script, which plots the stress of face z1 at every increment and the mean stress
of each grain at the end of each step, and prints the mean stresses.
#!/usr/bin/env python3
"""Post-processing of an FEPX simulation directory with Python, NumPy and Matplotlib.

The manual's tutorial "Post-processing in Python" (step 9.11). Run in the directory of the
tutorial "Simple simulation", after the run:

    python3 postprocess.py simulation.sim

It reads the text results of simulation.sim (output_format ascii) and writes:
  stress_time.png   the stress of face z1 (force over current area) at every increment
  grains.png        the stress 33 of each grain (the mean of its elements) at each printed step
and prints, at each printed step, the mean stress over the elements and over the grains.
"""

import os
import sys

import numpy as np
import matplotlib
matplotlib.use("Agg")
import matplotlib.pyplot as plt


def read_forces(sim_dir, faset):
    """The force table of a face set: one row per increment, columns
    step, increment, force x, force y, force z [N], area [mm^2], time [s]."""
    return np.loadtxt(os.path.join(sim_dir, "results", "forces", faset), comments="%",
                      ndmin=2)


def read_element_result(sim_dir, var, step):
    """An element result at a printed step: one row per element, one column per component
    (stress: 11 22 33 23 13 12)."""
    return np.loadtxt(os.path.join(sim_dir, "results", "elts", var, f"{var}.step{step}"),
                      ndmin=2)


def printed_steps(sim_dir, var):
    """The steps at which an element result was written, in order."""
    names = os.listdir(os.path.join(sim_dir, "results", "elts", var))
    return sorted(int(name.rsplit("step", 1)[1]) for name in names)


def read_element_grains(mesh_file):
    """The grain (element set) of each 3D element of a Neper mesh (msh format 2), in the order of
    the elements, which is the order of the element results."""
    grains = {}
    with open(mesh_file) as mesh:
        # Find the $Elements section; skip the element count.
        for line in mesh:
            if line.strip() == "$Elements":
                next(mesh)
                break
        # Each line: id, type, number of tags, tags (the first one is the element set), nodes.
        # Type 11 is the 10-node tetrahedron, type 4 the 4-node tetrahedron.
        for line in mesh:
            if line.strip() == "$EndElements":
                break
            fields = line.split()
            if fields[1] in ("4", "11"):
                grains[int(fields[0])] = int(fields[3])
    return np.array([grains[element] for element in sorted(grains)])


def main(sim_dir):
    """Read the results of sim_dir, plot them, and print the averages."""
    # The stress of face z1 at every increment: force z over the current area.
    forces = read_forces(sim_dir, "z1")
    time = forces[:, 6]
    stress_z1 = forces[:, 4] / forces[:, 5]
    figure, axis = plt.subplots(figsize=(4.5, 3.4), constrained_layout=True)
    axis.plot(time, stress_z1, color="#2a78d6", marker="o", linewidth=2)
    axis.set_xlabel("Time [s]")
    axis.set_ylabel("Force z / area of z1 [MPa]")
    axis.grid(color="#dddddd", linewidth=0.6)
    figure.savefig("stress_time.png", dpi=150)

    # The stress 33 of each grain at each printed step: the mean over the grain's elements.
    grains = read_element_grains(os.path.join(sim_dir, "inputs", "simulation.msh"))
    grain_ids = np.unique(grains)
    figure, axis = plt.subplots(figsize=(6.5, 3.4), constrained_layout=True)
    colors = ["#86b6ef", "#2a78d6", "#184f95"]
    steps = [step for step in printed_steps(sim_dir, "stress") if step > 0]
    for index, step in enumerate(steps):
        stress = read_element_result(sim_dir, "stress", step)
        grain_stress = np.array([stress[grains == grain, 2].mean() for grain in grain_ids])
        # Each step's bars side by side within each grain's slot.
        width = 0.8 / len(steps)
        axis.bar(grain_ids + (index - (len(steps) - 1) / 2) * width, grain_stress, width,
                 color=colors[index % len(colors)], label=f"step {step}")
        print(f"step {step}: mean stress 33 over the elements {stress[:, 2].mean():8.2f} MPa, "
              f"over the grains {grain_stress.mean():8.2f} MPa")
    axis.set_xlabel("Grain")
    axis.set_ylabel("Stress 33 (mean over the grain) [MPa]")
    axis.set_xticks(grain_ids)
    axis.legend(frameon=False)
    axis.grid(axis="y", color="#dddddd", linewidth=0.6)
    figure.savefig("grains.png", dpi=150)


if __name__ == "__main__":
    if len(sys.argv) != 2:
        sys.exit("usage: python3 postprocess.py <simulation.sim>")
    main(sys.argv[1])
In the directory of Simple simulation, after the run:
$ python3 postprocess.py simulation.sim
step 1: mean stress 33 over the elements   335.74 MPa, over the grains   335.15 MPa
step 2: mean stress 33 over the elements   346.09 MPa, over the grains   345.87 MPa
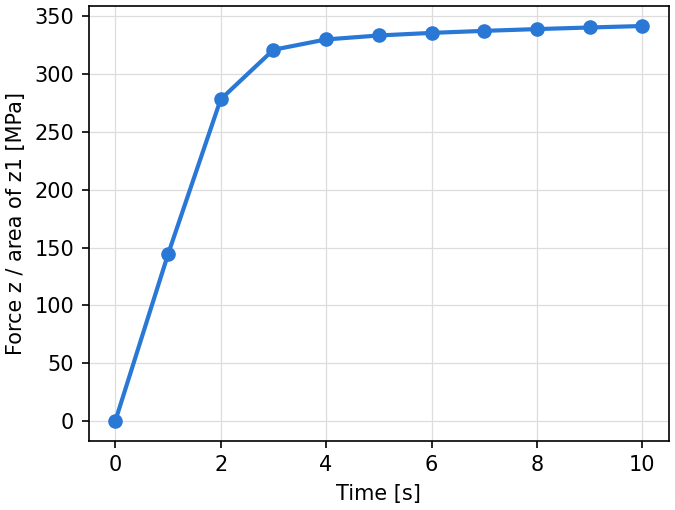
Fig. 37 stress_time.png: the stress of face z1 (force over current area) at every
increment.#
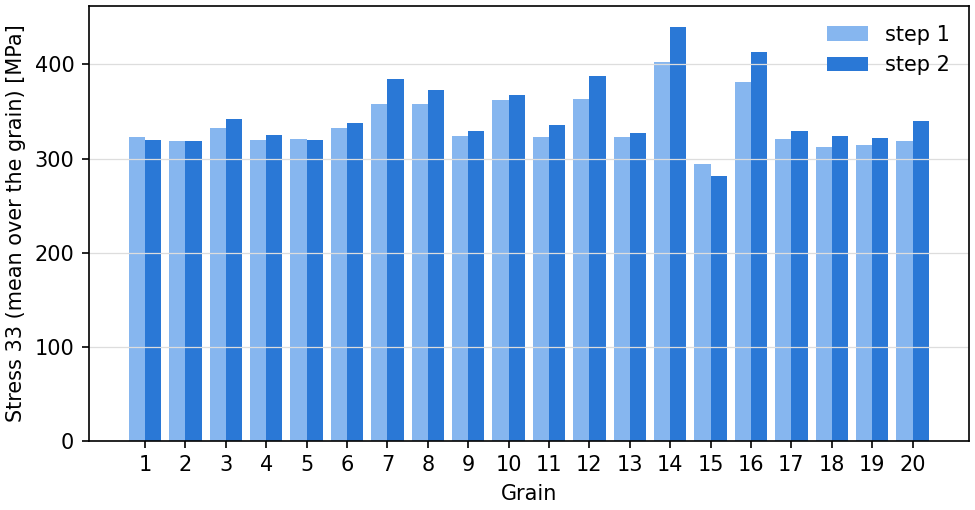
Fig. 38 grains.png: the stress 33 of each grain, the mean over its elements, at the end of
steps 1 and 2.#
Notes:
The element results are written once per element, in the order of the 3D elements of the mesh file, which is how the script matches them with their grains (the first tag of each element of the mesh file’s
$Elementssection).The mean over the elements is not volume-weighted. Neper computes the volume averages over the mesh (
neper -S simulation.sim -resmesh stress,strain, written tosimulation.sim/results/mesh) and over each grain (-reselset), as the other tutorials use for their stress-strain curves.With
output_format hdf5, the same results are insimulation.sim/simulation.h5, read with h5py (see Output formats).